So what is an Infographic?
Infographics
are a visual representation of data. When students create infographics, they
are using information, visual, and technology literacies. They can include numbers, text, images, or any
combination of the three. It is another tool for students to create a visual of
information that they have learned. It’s a digital display of knowledge and
research.
Using Infographics in the classroom allows the use of
technology to engage learners. A teacher can assign the analysis of infographics as a close reading assignment
can be one method for engaging students in coursework that can be rigorous,
relevant, and fun. Infographics allows students to communicate information that
they are learning, and it will help students understand and apply the content
that they are learning. All of these skills are essential for the 21st
century learner.
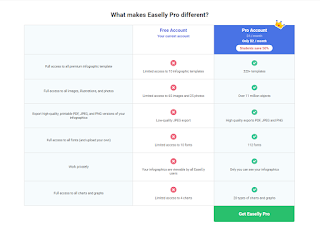
Easelly
It is a web based application that allows students and
teachers to make infographics. You can make
a free account to use the application. It allows teachers to have access to the
upgraded version for only $4.00 monthly which is reasonable. It has over 1.1
million illustrations and images, printable and high-quality version. It allows
you to create student accounts. When exploring the application it was user friendly
and had existing templates based on categories such as reports and checklist.
The cons of this application are the limited number of templates for the free
version. It also didn’t have a variety of charts and graphs for the user to
pick from.
Infogram
It is a web-based application that allows students and
teachers to make infographics. It also can
make a free account or purchase an upgraded account. It allows the user to make
a free account and choose from certain templates. It also has a membership
option. I feel that Infogram is marketed more towards business who need to save
money on a graphic designer. It works best for those who have some experience
with making an infographic. There weren’t any tutorials on how to design or use
the interface. A user must explore and learn the interface before one can use
it.
Piktochart
It is a web-based application that allows students and
teachers to make infographics. It also can
make a free account or purchase an upgraded account. Piktochart starts the
process by asking certain design question too to find different templates for
the user. The application also allows the user to make an infographic, digital
presentation, poster, reports and fliers. The pros to this application are it
has serval tutorials through out the application to make it easy for even the
most novice of users. It walks you step-by-step to build your infographic. It
also has the most templates in the education category of the three applications
reviewed. I chose to make infographics using Piktochart because of the user
tutorials being this was the first time I have ever made one. It had so many
tutorials and tools that made it user friendly and not overwhelming. The
template was easy to navigate and make it my own.
Example Infographic


I really liked your inforgraphic. It made me chuckle at first (the title), but when I got down to the nitty gritty of it all, I realized how much information was really in it! Next time, I would recommend making it a bit bigger to see all the details. If you need help, let me know!
ReplyDeleteYour infographic is awesome: you have a lot of different facts, colors, and fonts to make the facts interesting. It definitely helped to watch the tutorial on Piktochart because initially it seems like the infographic templates require a lot of work to fill in.
ReplyDelete